Tutorial: Getting Started with Machine Learning with the SciPy stack

Categories Machine Learning, Uncategorized
There are many machine learning libraries out there, but I heard that SciPy was good so I decided to try it out. We will be doing a simple walkthrough a k means clustering example:

Full Source Here


Sample Data Here

SciPy Stack

The contents of the SciPy stack are:

Python: Powerful scripting language
Numpy: Python package for numerical computing
SciPy: Python package for scientific computing
Matplotlib: Python package for plotting
iPython: Interactive python shell
Pandas: Python package for data analysis
SymPy: Python package for computer algebra systems
Nose: Python package for unit tests

Installation

I will go through my Mac installation but if you are using another OS, you can find the installation instructions for SciPy on: http://www.scipy.org/install.html.

You should have Python 2.7.

Mac Installation

I am using a Mac on OS X 10.8.5 and used MacPorts to setup the SciPy stack on my machine.

Install macports if you haven’t already: http://www.macports.org/

Otherwise open Terminal and run: ‘sudo macports selfupdate’

Next in your Terminal run: ‘sudo port install py27-numpy py27-scipy py27-matplotlib py27-ipython +notebook py27-pandas py27-sympy py27-nose’

Run the following in terminal to select package versions.

sudo port select –set python python27
sudo port select –set ipython ipython27

Hello World

IPython allows you to create interactive python notebooks in your browser. We will get started by creating a simple hello world notebook.
Create a new directory where you want your notebooks to be placed in.
In your directory, run in terminal:
ipython notebook

This should open your browser to the IPython notebook web interface. If it does not open, point your browser to http://localhost:8888.

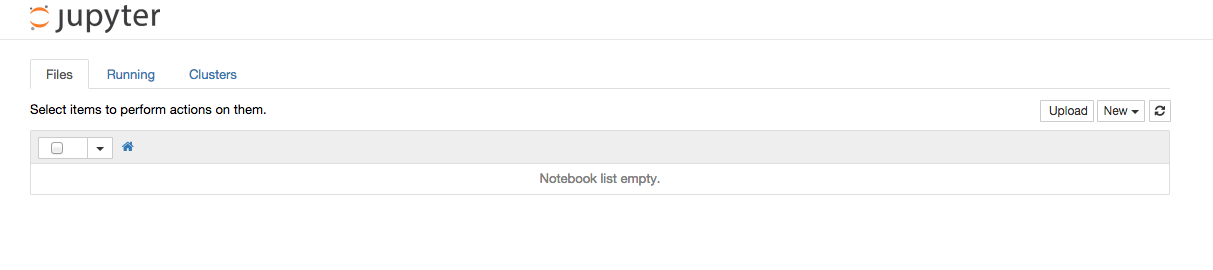
 Click New -> Notebooks -> Python 2


This should open a new tab with a newly create notebook.

Click Untitled at the top, rename the notebook to Hello World and press OK.

In the first line, change the line format from Code to Markdown and type in:

# Hello World Code

And click run (the black triangle that looks like a play button)

On the next line, in code, type:

print ‘Hello World’

and press run.

K Means Clustering Seed Example

Suppose we are doing a study on a wheat farm to determine how much of each kind of wheat is in the field. We collect a random sample of seeds from the field and measure different attributes such as area, perimeter, length, width, etc. Using this attributes we can use k-means clustering to classify seeds into different types and determine the percentage of each type.

Sample data can be found here: http://archive.ics.uci.edu/ml/datasets/seeds

The sample data contains data that comes from real measurements. The attributes are:

1. area A, 
2. perimeter P, 
3. compactness C = 4*pi*A/P^2, 
4. length of kernel, 
5. width of kernel, 
6. asymmetry coefficient 
7. length of kernel groove. 

Example: 15.26, 14.84, 0.871, 5.763, 3.312, 2.221, 5.22, 1

Download the file into the same folder as your notebook.

Code

Create a new notebook and name it whatever you want. We can put all the code into one cell.

First, we need to parse the data so that we can run k-means on it. We open the file using a csv reader and convert each cell to a float. We will skip rows that contain missing data.

Sample row:

['15.26', '14.84', '0.871', '5.763', '3.312', '2.221', '5.22', '1']
# Read data
for row in bank_csv:
    missing = False
    float_arr = []
    for cell in row:
        if not cell:
            missing = True
            break
        else:
            # Convert each cell to float
            float_arr.append(float(cell))
    # Take row if row is not missing data
    if not missing:
        data.append(float_arr)
data = np.array(data)

Next, we normalize the features for the k means algorithm. Since Scipy implements the k means clustering algorithm for us, all the hard work is done.

# Normalize vectors
whitened = vq.whiten(data)

# Perform k means on all features to classify into 3 groups
centroids, _ = vq.kmeans(whitened, 3)

We then classify each data point by distance to centroid:

# Classify data by distance to centroids
cls, _ = vq.vq(whitened, centroids)

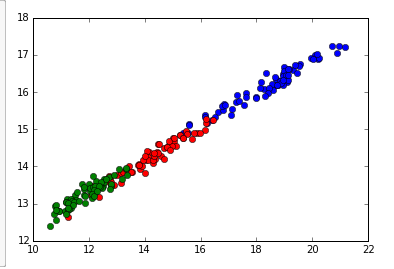
Finally, we can graph the classifications of the data points by the first two features. There are seven features total, but it would be hard to visualize. You can graph by other features for similar visualizations.

# Plot first two features (area vs perimter in this case)
plt.plot(data[cls==0,0], data[cls==0,6],'ob',
        data[cls==1,0], data[cls==1,6],'or',
        data[cls==2,0], data[cls==2,6],'og')
plt.show()

Note: to show the plot inline in the cell, we put ‘%matplotlib inline’ at the beginning of the cell.

Sample Data Here

Real time QR Code / Bar code detection with webcam using OpenCV and ZBar

Categories Computer Vision, Uncategorized

Tutorial: Real time QR Code / Bar code detection using webcam video feed / stream using OpenCV and ZBar

Pre-requisites:

You will need to have installed OpenCV and ZBar (see previous tutorials) for this to work.

Source on Github:  https://github.com/ayoungprogrammer/WebcamCodeScanner

Code:

 #include <opencv2/highgui/highgui.hpp>  
 #include <opencv2/imgproc/imgproc.hpp>  
 #include <zbar.h>  
 #include <iostream>  
 using namespace cv;  
 using namespace std;  
 using namespace zbar;  
 //g++ main.cpp /usr/local/include/ /usr/local/lib/ -lopencv_highgui.2.4.8 -lopencv_core.2.4.8  
 int main(int argc, char* argv[])  
 {  
   VideoCapture cap(0); // open the video camera no. 0  
   // cap.set(CV_CAP_PROP_FRAME_WIDTH,800);  
   // cap.set(CV_CAP_PROP_FRAME_HEIGHT,640);  
   if (!cap.isOpened()) // if not success, exit program  
   {  
     cout << "Cannot open the video cam" << endl;  
     return -1;  
   }  
   ImageScanner scanner;   
    scanner.set_config(ZBAR_NONE, ZBAR_CFG_ENABLE, 1);   
   double dWidth = cap.get(CV_CAP_PROP_FRAME_WIDTH); //get the width of frames of the video  
   double dHeight = cap.get(CV_CAP_PROP_FRAME_HEIGHT); //get the height of frames of the video  
   cout << "Frame size : " << dWidth << " x " << dHeight << endl;  
   namedWindow("MyVideo",CV_WINDOW_AUTOSIZE); //create a window called "MyVideo"  
   while (1)  
   {  
     Mat frame;  
     bool bSuccess = cap.read(frame); // read a new frame from video  
      if (!bSuccess) //if not success, break loop  
     {  
        cout << "Cannot read a frame from video stream" << endl;  
        break;  
     }  
     Mat grey;  
     cvtColor(frame,grey,CV_BGR2GRAY);  
     int width = frame.cols;   
     int height = frame.rows;   
     uchar *raw = (uchar *)grey.data;   
     // wrap image data   
     Image image(width, height, "Y800", raw, width * height);   
     // scan the image for barcodes   
     int n = scanner.scan(image);   
     // extract results   
     for(Image::SymbolIterator symbol = image.symbol_begin();   
     symbol != image.symbol_end();   
     ++symbol) {   
         vector<Point> vp;   
     // do something useful with results   
     cout << "decoded " << symbol->get_type_name() << " symbol "" << symbol->get_data() << '"' <<" "<< endl;   
       int n = symbol->get_location_size();   
       for(int i=0;i<n;i++){   
         vp.push_back(Point(symbol->get_location_x(i),symbol->get_location_y(i)));   
       }   
       RotatedRect r = minAreaRect(vp);   
       Point2f pts[4];   
       r.points(pts);   
       for(int i=0;i<4;i++){   
         line(frame,pts[i],pts[(i+1)%4],Scalar(255,0,0),3);   
       }   
       //cout<<"Angle: "<<r.angle<<endl;   
     }   
     imshow("MyVideo", frame); //show the frame in "MyVideo" window  
     if (waitKey(30) == 27) //wait for 'esc' key press for 30ms. If 'esc' key is pressed, break loop  
     {  
       cout << "esc key is pressed by user" << endl;  
       break;   
     }  
   }  
   return 0;  
 }  

To Test

Find any QR code or bar code and hold it close to your webcam and it should pick up.

Extacting Regions of Interest using Page Markers

Categories Computer Vision, Uncategorized

Source on GitHub: https://github.com/ayoungprogrammer/OMR-Example

Introduction

Optical Mark Recognition is recognizing certain “marks” on an image and using those marks as a reference point to extract other regions of interest (ROI) on the page. OMR is a relatively new technology and there is close to no documentation on the subject. Current OMR technologies like ScanTron require custom machines designed specifically to scan custom sheets of paper. These methods work well but the cost to produce the machines and paper is high as well as the inflexibility. Hopefully I can provide some insight into creating an efficient and effective OMR algorithm that uses standard household scanners and a simple template.

An OMR algorithm first needs a template page to know where ROI’s are in relation to the markers. It then needs to be able to scan a page and recognize where the markers are. Then using the template, the algorithm can determine where the ROI’s are in relation to the markers. In the case of ScanTrons, the markers are the black lines on the sides and ROI’s are the bubbles that are checked.

For an effective OMR, the markers should be at least halfway across the page from each other (either vertically or horizontally). The further apart the markers are, the higher accuracy you will achieve.

For the simplicity of this tutorial, we will use two QR codes with one in each corner as the markers. This will be our template:

Opening the template in Paint, we can find the coordinate of the ROI’s and markers.
Markers:
Top right point of first QR code:
1084,76
Bottom left point of second QR code:
77,1436
Region of Interests (ROI’s)
Name box:
(223,105) -> (603,152)
Payroll # box:
(223,152)->(603, 198)
Sin box:
(223, 198)->(603,244)
Address box:
(223,244)->(603,290)
Postal box:
(223, 291)->(603,336)
Picture:
(129,491) -> (766,806)

Using the coordinate we can do some simple math to find the relative positioning of the ROI’s.

We can also find the angle of rotation from the markers. If we find the angle between the top right corner and bottom left corner of the template markers we get: 53.48222 degrees. If we find that the markers we scan have is something different from that angle, we rotate the whole page by that angle, it will fix the skewed rotation.

Scanned image:

OMR Processed Image + Fixed rotation

Extensions

Two QR Codes in each corner looks ugly but there are many other types of markers you can use.
Once you have the coordinates of the ROI’s you can easily extract them and possibly OCR the data you need.
If you want to OMR a page where you have no control over the template you need to do some heuristics to find some sort of markers on the page (for example looking for a logo or line detection).
You can easily add an extension for multiple choice or checkboxes and extract the ROI to determine the selection.
In real applications you will want to create your own template dynamically and encode the ROI data somewhere so you do not have to manually enter the coordinates of the marker and ROI’s.

Source Code

Source on Github: https://github.com/ayoungprogrammer/OMR-Example


#include <opencv2/highgui/highgui.hpp>
#include <opencv2/imgproc/imgproc.hpp>
#include <zbar.h>
#include <iostream>

using namespace cv;
using namespace std;
using namespace zbar;

//g++ main.cpp /usr/local/include/ /usr/local/lib/ -lopencv_highgui.2.4.8 -lopencv_core.2.4.8

void drawQRCodes(Mat img,Image& image){
  // extract results 
  for(Image::SymbolIterator symbol=image.symbol_begin(); symbol != image.symbol_end();++symbol) { 
    vector<Point> vp; 

    //draw QR Codes
    int n = symbol->get_location_size(); 
    for(int i=0;i<n;i++){ 
      vp.push_back(Point(symbol->get_location_x(i),symbol->get_location_y(i))); 
    } 
    RotatedRect r = minAreaRect(vp); 
    Point2f pts[4]; 
    r.points(pts); 
    //Display QR code
    for(int i=0;i<4;i++){ 
      line(img,pts[i],pts[(i+1)%4],Scalar(255,0,0),3); 
    } 
  } 
}

Rect makeRect(float x,float y,float x2,float y2){
  return Rect(Point2f(x,y),Point2f(x2,y2));
}

Point2f rotPoint(Point2f p,Point2f o,double rad){
  Point2f p1 = Point2f(p.x-o.x,p.y-o.y);

  return Point2f(p1.x * cos(rad)-p1.y*sin(rad)+o.x,p1.x*sin(rad)+p1.y*cos(rad)+o.y);
}

void drawRects(Mat& img,Point2f rtr,Point2f rbl){
  vector<Rect> rects;

  Point2f tr(1084,76);
  Point2f bl(77,1436);

  rects.push_back(makeRect(223,105,603,152));
  rects.push_back(makeRect(223,152,603,198));
  rects.push_back(makeRect(223,198,603,244));
  rects.push_back(makeRect(223,244,603,290));
  rects.push_back(makeRect(223,291,603,336));

  rects.push_back(makeRect(129,491,765,806));


  //Fix rotation angle
  double angle = atan2(tr.y-bl.y,tr.x-bl.x);
  double realAngle = atan2(rtr.y-rbl.y,rtr.x-rbl.x);

  double angleShift = -(angle-realAngle);

  //Rotate image
  Point2f rc((rtr.x+rbl.x)/2,(rbl.y+rtr.y)/2);
  Mat rotMat = getRotationMatrix2D(rc,angleShift/3.14159265359*180.0,1.0);
  warpAffine(img,img,rotMat,Size(img.cols,img.rows),INTER_CUBIC,BORDER_TRANSPARENT);

  rtr = rotPoint(rtr,rc,-angleShift);
  rbl = rotPoint(rbl,rc,-angleShift);

  //Calculate ratio between template and real image
  double realWidth = rtr.x-rbl.x;
  double realHeight = rbl.y-rtr.y;

  double width = tr.x-bl.x;
  double height = bl.y - tr.y;

  double wr = realWidth/width;
  double hr = realHeight/height;

  circle(img,rbl,3,Scalar(0,255,0),2);
  circle(img,rtr,3,Scalar(0,255,0),2);

  for(int i=0;i<rects.size();i++){
    Rect r = rects[i];
    double x1 = (r.x-tr.x)*wr+rtr.x;
    double y1 = (r.y-tr.y)*hr+rtr.y;
    double x2 = (r.x+r.width-tr.x)*wr +rtr.x;
    double y2 = (r.y+r.height-tr.y)*hr + rtr.y;
    rectangle(img,Point2f(x1,y1),Point2f(x2,y2),Scalar(0,0,255),3);
    //circle(img,Point2f(x1,y1),3,Scalar(0,0,255));
  }
}

int main(int argc, char* argv[])
{
  Mat img = imread(argv[1]);

  ImageScanner scanner; 
  scanner.set_config(ZBAR_NONE, ZBAR_CFG_ENABLE, 1); 

  namedWindow("OMR",CV_WINDOW_AUTOSIZE); //create a window

  Mat grey;
  cvtColor(img,grey,CV_BGR2GRAY);

  int width = img.cols; 
  int height = img.rows; 
  uchar *raw = (uchar *)grey.data; 
  // wrap image data 
  Image image(width, height, "Y800", raw, width * height); 
  // scan the image for barcodes 
  scanner.scan(image); 

  //Top right point
  Point2f tr(0,0);
  Point2f bl(0,0);

  // extract results 
  for(Image::SymbolIterator symbol = image.symbol_begin(); symbol != image.symbol_end();++symbol) { 
    vector<Point> vp; 

   //Find TR point
   if(tr.y==0||tr.y>symbol->get_location_y(3)){
     tr = Point(symbol->get_location_x(3),symbol->get_location_y(3));
   }

   //Find BL point
   if(bl.y==0||bl.y<symbol->get_location_y(1)){
     bl = Point(symbol->get_location_x(1),symbol->get_location_y(1));
   }
  } 

  drawQRCodes(img,image);
  drawRects(img,tr,bl);
  imwrite("omr.jpg", img); 

  return 0;
}

Tutorial: Setting up and Installing the MEAN stack

Categories Uncategorized

Tutorial: Setting up the MEAN stack

The MEAN stack: (MongoDB, ExpressJS, AngularJS and Node.JS) are a group of powerful technologies that allow you to write a completely functional website from back-end to front-end using only Javascript. Using only Javascript allows developers to only in one language instead of managing several different languages (such as PHP or Ruby) from front and back end. Javascript does have its own pitfalls, but it is still a powerful language is utilized correctly.
MongoDB: Open source NoSQL database
ExpressJS: Web application framework for node (serves front end)
NodeJS: Fast efficient nonblocking backend 
AngularJS: Front end for enhancing web apps

Project available on GitHub: https://github.com/ayoungprogrammer/meanTemplate

Install Eclipse IDE

For web development, I find Eclipse is very useful as it comes with a visual of the file system and can compile from the IDE. 

Install Node.JS

Download nodejs at:

Install ExpressJS

In console type:
npm install express -g
This will install express globally on your machine.
You may need to use 
sudo npm install express -g

Install Nodeclipse for using Node.js in Eclipse

Follow instructions at:

Install MongoDB

Follow download instructions at:
For MacOSX you can use homebrew to install mongoDB quickly:
brew install mongodb
Create your first Express project
In Eclipse -> File -> New -> Express Project
Type in your new project name and click finish when done.
You should have a project that looks like this:
public
     |——-   stylesheets
                        |————-styles.css
routes
      |—————index.js
      |—————user.js
view
      |—————layout.jade
      |—————index.jade
app.js
package.json
README.md
Here is an explanation of what each thing does:
public: Everything in the public folder is served to the client by expressJS
stylesheets: Commonly, this folder will contain all the .css files for a website
styles.css: This is the current CSS file for the default webpage
routes: This folder contains the routes files for which requests are directed
index.js: This file contains the routes for index
user.js: This file contains the routes for users [this can be deleted]
view: This folder contains the views of the application
layout.jade: This file is the default template of a webpage
index.jade: This file is the index webpage
app.js This is the main file that node.js runs
package.json: This file tells node the project dependencies to install
README.md: This file tells another developer what the project is
      
The project currently uses the Jade templating engine to render pages. A template engine compiles source files into html files. 

Run the app

In console type:
node app.js
In your browser, type in the url: http://localhost:3000
If you have done everything correctly, then you should see this:

Express

Welcome to Express

Install Bower

Bower is a tool for installing other libraries similar to npm.
To install, type the following into a console:
npm install bower -g 
If you have errors, you may need to use 
sudo npm install bower -g 
Create a folder called public/js
This folder is where all the javascript files will be placed for the front end
Create another folder called public/js/vendor
This folder is where all the vendor Javascript libraries will be placed. Vendor means external 3rd party libraries such as AngularJS which we will be installing.
Create a file called .bowerrc in your project directory with the following:
{ “directory” : “public/js/vendor” }
Everything that bower installs will be put into /public/js/vendor.

Install AngularJS

We use bower to install AngularJS by typing in console:
bower install angular
This should install angularjs into public/js/vendor. At the time of writing this tutorial, the version is 1.2.3.
Install Mongoose
Mongoose is the api to connect to MongoDB.
We can install it by adding a dependency in package.json:
 “dependencies”: {
    “express”: “3.4.0”,
    “jade”: “*”,
    “mongoose”: “*”
  }
and putting into console from the project directory:
npm install 
NPM will automatically look at package.json and look for dependencies to install. 

Your tools are ready!

The MEAN stack tools are all ready and installed but the project does not do anything right now.
We will build a MEAN app in the next part of the tutorial.

Tutorial: Scanning Barcodes / QR Codes with OpenCV using ZBar

Categories Computer Vision, Uncategorized
With the ZBar library, scanning Barcodes / QR codes is quite simple. ZBar is able to identify multiple bar code /qr code types and able to give the coords of their locations.

This tutorial was written using:
Microsoft Visual Studio 2008 Express
OpenCV 2.4.2
Windows Vista 32-bit
ZBar 0.1

You will need OpenCV installed before doing this tutorial

Tutorial here: http://ayoungprogrammer.blogspot.ca/2012/10/tutorial-install-opencv-242-for-windows.html

1. Install ZBar (Windows Installer)

http://sourceforge.net/projects/zbar/files/zbar/0.10/zbar-0.10-setup.exe/download

Check install developmental libraries and headers (You will need this)

Install ZBar in the default directory
“C:Program FilesZBar”

2. Import headers and libraries

Tools ->Options 

Projects & Solutions -> VC++ Directories
Go to “Include files” and add: “C:Program FilesZBarinclude”

 Go to “Library files and add: “C:Program FilesZBarlib”

3. Link libraries in current project

Create an empy blank console project
Right click your project -> Properties -> Configuration Properties -> Linker -> Input

In additional dependencies copy and paste the following:
libzbar-0.lib
opencv_core242d.lib
opencv_imgproc242d.lib
opencv_highgui242d.lib
opencv_ml242d.lib
opencv_video242d.lib
opencv_features2d242d.lib
opencv_calib3d242d.lib
opencv_objdetect242d.lib
opencv_contrib242d.lib
opencv_legacy242d.lib
opencv_flann242d.lib

4. Test Program

Make a new file in your project: main.cpp
 #include "zbar.h"  
 #include "cv.h"  
 #include "highgui.h"  
 #include <iostream>  
 using namespace std;  
 using namespace zbar;  
 using namespace cv;  
 int main(void){  
      ImageScanner scanner;  
      scanner.set_config(ZBAR_NONE, ZBAR_CFG_ENABLE, 1);  
       // obtain image data  
      char file[256];  
      cin>>file;  
      Mat img = imread(file,0);  
      Mat imgout;  
      cvtColor(img,imgout,CV_GRAY2RGB);  
      int width = img.cols;  
      int height = img.rows;  
   uchar *raw = (uchar *)img.data;  
   // wrap image data  
   Image image(width, height, "Y800", raw, width * height);  
   // scan the image for barcodes  
   int n = scanner.scan(image);  
   // extract results  
   for(Image::SymbolIterator symbol = image.symbol_begin();  
     symbol != image.symbol_end();  
     ++symbol) {  
                vector<Point> vp;  
     // do something useful with results  
     cout << "decoded " << symbol->get_type_name()  
        << " symbol "" << symbol->get_data() << '"' <<" "<< endl;  
           int n = symbol->get_location_size();  
           for(int i=0;i<n;i++){  
                vp.push_back(Point(symbol->get_location_x(i),symbol->get_location_y(i))); 
           }  
           RotatedRect r = minAreaRect(vp);  
           Point2f pts[4];  
           r.points(pts);  
           for(int i=0;i<4;i++){  
                line(imgout,pts[i],pts[(i+1)%4],Scalar(255,0,0),3);  
           }  
           cout<<"Angle: "<<r.angle<<endl;  
   }  
      imshow("imgout.jpg",imgout);  
   // clean up  
   image.set_data(NULL, 0);  
       waitKey();  
 }  

5. Copy libzbar-0.dll from C:/Program Files/ZBar/bin to your project folder

6. Run program 

Sample Images

Tutorial: Detection / recognition of multiple rectangles and extracting with OpenCV

Categories Computer Vision, Uncategorized

 This tutorial will be focused on being able to take a picture and extract the rectangles in the image that are above a certain size:

I am using OpenCV 2.4.2 on Microsoft Visual Express 2008 but it should work with other version as well.

Thanks to: opencv-code.com for their helpful guides

Step 1: Clean up

So once again, we’ll use my favourite snippet for cleaning up an image:
Apply a Gaussian blur and using an adaptive threshold for binarzing the image
//Apply blur to smooth edges and use adapative thresholding  
 cv::Size size(3,3);  
 cv::GaussianBlur(img,img,size,0);  
 adaptiveThreshold(img, img,255,CV_ADAPTIVE_THRESH_MEAN_C, CV_THRESH_BINARY,75,10);  
 cv::bitwise_not(img, img);  

Step 2: Hough Line detection

Use a probabilistic Hough line detection to figure out where the lines are. This algorithm works by going through every point in the image and checking every angle. 
 vector<Vec4i> lines;  
 HoughLinesP(img, lines, 1, CV_PI/180, 80, 100, 10);  
And here we have the results of the algorithm:

Step 3: Use connected components to determine what they shapes are

This is the most complex part of the algorithm (general pseudocode):
First, initialize every line to be in an undefined group
For every line compute the intersection of the two line segments (if they do not intersect ignore the point)
      If both lines are undefined, make a new group out of them
      If only one line is defined in a group, add the other line into the group. 
      If both lines are defined than add all the lines from one group into the other group
      If both lines are in the same group, do nothing
cv::Point2f computeIntersect(cv::Vec4i a, cv::Vec4i b)  
 {  
   int x1 = a[0], y1 = a[1], x2 = a[2], y2 = a[3];  
   int x3 = b[0], y3 = b[1], x4 = b[2], y4 = b[3];  
   if (float d = ((float)(x1-x2) * (y3-y4)) - ((y1-y2) * (x3-x4)))  
   {  
     cv::Point2f pt;  
     pt.x = ((x1*y2 - y1*x2) * (x3-x4) - (x1-x2) * (x3*y4 - y3*x4)) / d;  
     pt.y = ((x1*y2 - y1*x2) * (y3-y4) - (y1-y2) * (x3*y4 - y3*x4)) / d;  
           //-10 is a threshold, the POI can be off by at most 10 pixels
           if(pt.x<min(x1,x2)-10||pt.x>max(x1,x2)+10||pt.y<min(y1,y2)-10||pt.y>max(y1,y2)+10){  
                return Point2f(-1,-1);  
           }  
           if(pt.x<min(x3,x4)-10||pt.x>max(x3,x4)+10||pt.y<min(y3,y4)-10||pt.y>max(y3,y4)+10){  
                return Point2f(-1,-1);  
           }  
     return pt;  
   }  
   else  
     return cv::Point2f(-1, -1);  
 }  
Connected components
int* poly = new int[lines.size()];  
  for(int i=0;i<lines.size();i++)poly[i] = - 1;  
  int curPoly = 0;  
       vector<vector<cv::Point2f> > corners;  
      for (int i = 0; i < lines.size(); i++)  
      {  
           for (int j = i+1; j < lines.size(); j++)  
           {  
          
                cv::Point2f pt = computeIntersect(lines[i], lines[j]);  
                if (pt.x >= 0 && pt.y >= 0&&pt.x<img2.size().width&&pt.y<img2.size().height){  
              
                     if(poly[i]==-1&&poly[j] == -1){  
                          vector<Point2f> v;  
                          v.push_back(pt);  
                          corners.push_back(v);       
                          poly[i] = curPoly;  
                          poly[j] = curPoly;  
                          curPoly++;  
                          continue;  
                     }  
                     if(poly[i]==-1&&poly[j]>=0){  
                          corners[poly[j]].push_back(pt);  
                          poly[i] = poly[j];  
                          continue;  
                     }  
                     if(poly[i]>=0&&poly[j]==-1){  
                          corners[poly[i]].push_back(pt);  
                          poly[j] = poly[i];  
                          continue;  
                     }  
                     if(poly[i]>=0&&poly[j]>=0){  
                          if(poly[i]==poly[j]){  
                               corners[poly[i]].push_back(pt);  
                               continue;  
                          }  
                        
                          for(int k=0;k<corners[poly[j]].size();k++){  
                               corners[poly[i]].push_back(corners[poly[j]][k]);  
                          }  
                       
                          corners[poly[j]].clear();  
                          poly[j] = poly[i];  
                          continue;  
                     }  
                }  
           }  
      }  
The circles represent the points of intersection and the colours represent the different shapes. 

Step 4: Find corners of the polygon

Now we need to find corners of the polygons to get the polygon formed from the point of intersections.
Pseudocode:
For each group of points:
       Compute mass center (average of points)
        For each point that is above the mass center, add to top list
        For each point that is below the mass center, add to bottom list
        Sort top list and bottom list by x val
       first element of top list is  left most (top left point)
        last element of top list is right most (top right point) 
       first element of bottom list is  left most  (bottom left point)
       last element of bottom list is right most  (bottom right point) 


 bool comparator(Point2f a,Point2f b){  
           return a.x<b.x;  
      }  
 void sortCorners(std::vector<cv::Point2f>& corners, cv::Point2f center)  
 {  
   std::vector<cv::Point2f> top, bot;  
   for (int i = 0; i < corners.size(); i++)  
   {  
     if (corners[i].y < center.y)  
       top.push_back(corners[i]);  
     else  
       bot.push_back(corners[i]);  
   }  
      sort(top.begin(),top.end(),comparator);  
      sort(bot.begin(),bot.end(),comparator);  
   cv::Point2f tl = top[0];
   cv::Point2f tr = top[top.size()-1];
   cv::Point2f bl = bot[0];
   cv::Point2f br = bot[bot.size()-1];  
   corners.clear();  
   corners.push_back(tl);  
   corners.push_back(tr);  
   corners.push_back(br);  
   corners.push_back(bl);  
 }  
for(int i=0;i<corners.size();i++){  
           cv::Point2f center(0,0);  
           if(corners[i].size()<4)continue;  
           for(int j=0;j<corners[i].size();j++){  
                center += corners[i][j];  
           }  
           center *= (1. / corners[i].size());  
           sortCorners(corners[i], center);  
      }  

Step 5: Extraction

The final step is extract each rectangle from the image. We can do this quite easily with the perspective transform from OpenCV. To get an estimate of the dimensions of the rectangle we can use a bounding rectangle of the corners. If the dimensions of that rectangle are under our wanted area, we ignore the polygon. If the polygon also has less than 4 points we can ignore it as well. 
for(int i=0;i<corners.size();i++){  
           if(corners[i].size()<4)continue;  
           Rect r = boundingRect(corners[i]);  
           if(r.area()<50000)continue;  
           cout<<r.area()<<endl;  
           // Define the destination image  
           cv::Mat quad = cv::Mat::zeros(r.height, r.width, CV_8UC3);  
           // Corners of the destination image  
           std::vector<cv::Point2f> quad_pts;  
           quad_pts.push_back(cv::Point2f(0, 0));  
           quad_pts.push_back(cv::Point2f(quad.cols, 0));  
           quad_pts.push_back(cv::Point2f(quad.cols, quad.rows));  
           quad_pts.push_back(cv::Point2f(0, quad.rows));  
           // Get transformation matrix  
           cv::Mat transmtx = cv::getPerspectiveTransform(corners[i], quad_pts);  
           // Apply perspective transformation  
           cv::warpPerspective(img3, quad, transmtx, quad.size());  
           stringstream ss;  
           ss<<i<<".jpg";  
           imshow(ss.str(), quad);  
      }  

Tutorial: Creating a Multiple Choice Scanner with OpenCV

Categories Computer Vision, Uncategorized
EDIT (July 14, 2016): A better way to extract would be to use page markers.
This is a tutorial on creating a multiple choice scanner similar to the Scantron system. We will take a photo of a multiple choice answer sheet and we will find the corresponding letter of the bubbles. I will be using OpenCV 2.4.3 for this project.

Source code : https://github.com/ayoungprogrammer/MultipleChoiceScanner

Algorithm

We can split the algorithm into 9 parts:
1. Perform image preprocessing to make the image black & white (binarization)
2. Use hough transform to find the lines in the image
3. Find point of intersection of lines to form the quadrilateral
4. Apply a perspective transform to the quadrilateral
5. Use hough transform to find the circles in the image
6. Sort circles into rows and columns
7. Find circles with area 30% or denser and designate these as “filled in”
Thanks to this tutorial for helping me find POI and using perspective transformation

1. Image Preprocesssing

I like to use my favourite binarization method for cleaning up the image:
 – First apply a gaussian blur to blur the image a bit to get rid of random dots
 – Use adaptive thresholding to set each pixel to black or white
 cv::Size size(3,3);  
 cv::GaussianBlur(img,img,size,0);  
 adaptiveThreshold(img, img,255,CV_ADAPTIVE_THRESH_MEAN_C, CV_THRESH_BINARY,75,10);  
  cv::bitwise_not(img, img);


We get a nice clean image with distinct shapes marked in white. However, we do get a few dots of white but they shouldn’t affect anything.

2. Hough transfrom to get lines

Use a probabilistic Hough line detection to find the sides of the rectangle. It works by going to every point in the image and checking if a line exists for all the angles. This is the most expensive operation in the whole process because it has to check every point and angle.
 cv::Mat img2;  
  cvtColor(img,img2, CV_GRAY2RGB);  
  vector<Vec4i> lines;  
  HoughLinesP(img, lines, 1, CV_PI/180, 80, 400, 10);  
  for( size_t i = 0; i < lines.size(); i++ )  
  {  
   Vec4i l = lines[i];  
   line( img2, Point(l[0], l[1]), Point(l[2], l[3]), Scalar(0,0,255), 3, CV_AA);   
  }

3. Find POI of lines

From: http://opencv-code.com/tutorials/automatic-perspective-correction-for-quadrilateral-objects/

However, we need to sort the points from top left to bottom right:

 bool comparator(Point2f a,Point2f b){  
  return a.x<b.x;  
  }  
 void sortCorners(std::vector<cv::Point2f>& corners, cv::Point2f center)  
 {  
   std::vector<cv::Point2f> top, bot;  
   for (int i = 0; i < corners.size(); i++)  
   {  
     if (corners[i].y < center.y)  
       top.push_back(corners[i]);  
     else  
       bot.push_back(corners[i]);  
   }  
  sort(top.begin(),top.end(),comparator);  
  sort(bot.begin(),bot.end(),comparator);  
   cv::Point2f tl = top[0].x;  
   cv::Point2f tr = top[top.size()-1];  
   cv::Point2f bl = bot[0];  
   cv::Point2f br = bot[bot.size()-1];  
   corners.clear();  
   corners.push_back(tl);  
   corners.push_back(tr);  
   corners.push_back(br);  
   corners.push_back(bl);  
 }  
 // Get mass center  
  cv::Point2f center(0,0);  
  for (int i = 0; i < corners.size(); i++)  
  center += corners[i];  
  center *= (1. / corners.size());  
  sortCorners(corners, center);

4. Apply a perspective transform

At first I used a minimum area rectangle for extracting the region and cropping it but i got a slanted image. Because the picture was taken at an angle, the rectangle we took a picture of, has become a trapezoid. However, if you’re using a scanner, than this shouldn’t be too much an issue.
However, we can fix this with a perspective transform and OpenCV supplies a function for doing so.
 // Get transformation matrix  
  cv::Mat transmtx = cv::getPerspectiveTransform(corners, quad_pts);  
  // Apply perspective transformation  
  cv::warpPerspective(img3, quad, transmtx, quad.size());

5. Find circles

We use Hough transform to find all the circles using a provided function for detecting them.
 
cvtColor(img,cimg, CV_BGR2GRAY);
 vector<Vec3f> circles;  
   HoughCircles(cimg, circles, CV_HOUGH_GRADIENT, 1, img.rows/16, 100, 75, 0, 0 );  
     for( size_t i = 0; i < circles.size(); i++ )  
   {  
   Point center(cvRound(circles[i][0]), cvRound(circles[i][1]));  
   int radius = cvRound(circles[i][2]);  
   // circle center  
   circle( testImg, center, 3, Scalar(0,255,0), -1, 8, 0 );  
   // circle outline


6. Sort circles into rows and columns

Now that we have the valid circles we should sort them into rows and columns. We can check if two circles are in a row with a simple test:
y1 = y coordinate of centre of circle 1
y2 = y coordinate of centre of circle 2
r = radius
y2-r > y1 and y2+r<y1
If two circles pass this test, then we can say that they are in the same row. We do this to all the circle until we have figure out which circles are in which rows.Row is an array of data about each row and index. The double part of the pair is the y coord of the row and the int is the index of arrays in bubble (used for sorting).

 vector<vector<Vec3f> > bubble;  
 vector<pair<double,int> > row;  
 for(int i=0;i<circles.size();i++){  
  bool found = false;  
  int r = cvRound(circles[i][2]);   
   int x = cvRound(circles[i][0]);  
   int y= cvRound(circles[i][1]);  
  for(int j=0;j<row.size();j++){  
 int y2 = row[j].first;  
   if(y-r<y2&&y+r>y2){  
   bubble[j].push_back(circles[i]);  
   found = true;  
   break;  
   }  
  }  
  if(!found){  
   int l = row.size();  
   row.push_back(make_pair(y,l));  
   vector<Vec3f> v;  
   v.push_back(circles[i]);  
   bubble.push_back(v);  
  }  
  found = false;  
  }

Then sort the rows by y coord and inside each row sort by x coord so you will have a order from top to bottom and left to right.

bool comparator2(pair<double,int> a,pair<double,int> b){  
  return a.first<b.first;  
 }  
 bool comparator3(Vec3f a,Vec3f b){  
  return a[0]<b[0];  
 }  
 ....  
 sort(row.begin(),row.end(),comparator2);  
 for(int i=0;i<bubble.size();i++){  
  sort(bubble[i].begin(),bubble[i].end(),comparator3);  
 }

7. Check bubble

Now that we have each circle sorted, in each row we can check if the density of pixels is 30% or higher which will indicate that it is filled in.
We can use countNonZero to count the filled in pixels over the area of the region.
In each row, we look for the highest filled density over 30% and it will most likely be the answer that is highlighted. However, if none are found then it is blank.
for(int i=0;i<row.size();i++){  
   double max = 0;  
   int ind = -1;  
   for(int j=0;j<bubble[row[i].second].size();j++){  
    Vec3f cir = bubble[row[i].second][j];  
    int r = cvRound(cir[2]);  
    int x = cvRound(cir[0]);  
    int y= cvRound(cir[1]);  
   Point c(x,y);  
    // circle outline  
   circle( img, c, r, Scalar(0,0,255), 3, 8, 0 );  
   Rect rect(x-r,y-r,2*r,2*r);  
   Mat submat = cimg(rect);  
   double p =(double)countNonZero(submat)/(submat.size().width*submat.size().height);  
   if(p>=0.3 && p>max){  
    max = p;  
    ind = j;  
   }  
   }  
       if(ind==-1)printf("%d:-",i+1);  
   else printf("%d:%c",i+1,'A'+ind);  
   cout<<endl;  
     }  
 }