Real time QR Code / Bar code detection with webcam using OpenCV and ZBar
Categories Computer Vision, Uncategorized
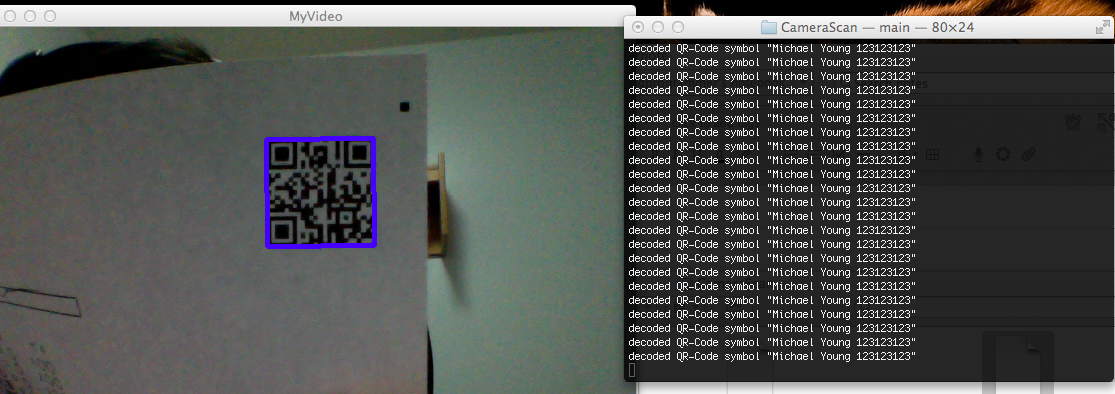
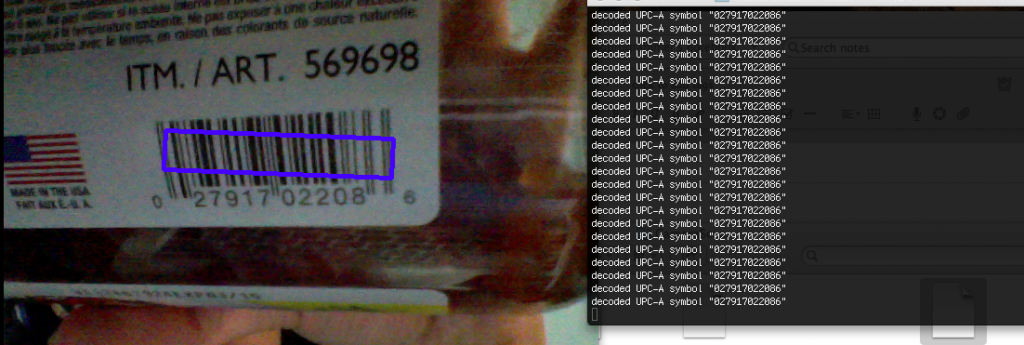
Tutorial: Real time QR Code / Bar code detection using webcam video feed / stream using OpenCV and ZBar

Pre-requisites:
You will need to have installed OpenCV and ZBar (see previous tutorials) for this to work.
Source on Github: https://github.com/ayoungprogrammer/WebcamCodeScanner
Code:
#include <opencv2/highgui/highgui.hpp>
#include <opencv2/imgproc/imgproc.hpp>
#include <zbar.h>
#include <iostream>
using namespace cv;
using namespace std;
using namespace zbar;
//g++ main.cpp /usr/local/include/ /usr/local/lib/ -lopencv_highgui.2.4.8 -lopencv_core.2.4.8
int main(int argc, char* argv[])
{
VideoCapture cap(0); // open the video camera no. 0
// cap.set(CV_CAP_PROP_FRAME_WIDTH,800);
// cap.set(CV_CAP_PROP_FRAME_HEIGHT,640);
if (!cap.isOpened()) // if not success, exit program
{
cout << "Cannot open the video cam" << endl;
return -1;
}
ImageScanner scanner;
scanner.set_config(ZBAR_NONE, ZBAR_CFG_ENABLE, 1);
double dWidth = cap.get(CV_CAP_PROP_FRAME_WIDTH); //get the width of frames of the video
double dHeight = cap.get(CV_CAP_PROP_FRAME_HEIGHT); //get the height of frames of the video
cout << "Frame size : " << dWidth << " x " << dHeight << endl;
namedWindow("MyVideo",CV_WINDOW_AUTOSIZE); //create a window called "MyVideo"
while (1)
{
Mat frame;
bool bSuccess = cap.read(frame); // read a new frame from video
if (!bSuccess) //if not success, break loop
{
cout << "Cannot read a frame from video stream" << endl;
break;
}
Mat grey;
cvtColor(frame,grey,CV_BGR2GRAY);
int width = frame.cols;
int height = frame.rows;
uchar *raw = (uchar *)grey.data;
// wrap image data
Image image(width, height, "Y800", raw, width * height);
// scan the image for barcodes
int n = scanner.scan(image);
// extract results
for(Image::SymbolIterator symbol = image.symbol_begin();
symbol != image.symbol_end();
++symbol) {
vector<Point> vp;
// do something useful with results
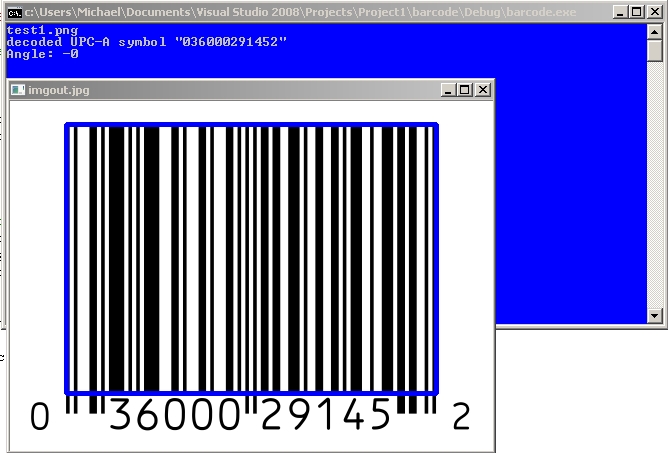
cout << "decoded " << symbol->get_type_name() << " symbol "" << symbol->get_data() << '"' <<" "<< endl;
int n = symbol->get_location_size();
for(int i=0;i<n;i++){
vp.push_back(Point(symbol->get_location_x(i),symbol->get_location_y(i)));
}
RotatedRect r = minAreaRect(vp);
Point2f pts[4];
r.points(pts);
for(int i=0;i<4;i++){
line(frame,pts[i],pts[(i+1)%4],Scalar(255,0,0),3);
}
//cout<<"Angle: "<<r.angle<<endl;
}
imshow("MyVideo", frame); //show the frame in "MyVideo" window
if (waitKey(30) == 27) //wait for 'esc' key press for 30ms. If 'esc' key is pressed, break loop
{
cout << "esc key is pressed by user" << endl;
break;
}
}
return 0;
}
To Test
Find any QR code or bar code and hold it close to your webcam and it should pick up.